Visualization
The library includes some basic visualization tools that can be very useful in your development. You can get cool plots like this one:
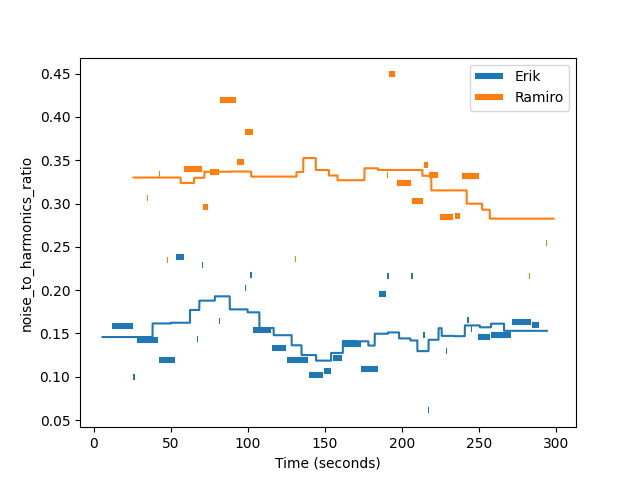
The code need to get that plot is just this:
from entrainment_metrics.continuous import plot_time_series

plot_time_series(
            time_series_a=a_time_series,
            time_series_b=another_time_series,
            time_series_a_name="Erik",
            time_series_b_name="Ramiro",
        )
Furthermore, TimeSeries have a plot() method that can get a plot like this for a unique TimeSeries instance. You can check that in the Continuous documentation.
You can also plot only InterPausalUnits:
from entrainment_metrics import plot_ipus

plot_ipus(ipus, some_feature)
Finally, with print_ipus_information() you can get some insightful information from a list of InterPausalUnit.